Submitted by Alex Leith on Sat, 07/04/2015 - 14:16
Team Name:
MapMap
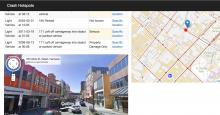
Tasmanian Crash Hotspots
Where do accidents happen a lot? What are the roads like in those areas? Is there a link?
There is a dataset of car crashes all over Tasmania, but it doesn't tell a story. Perhaps if we look at where the crashes are happening in terms of the piece of road that the occur on, we'll be able to identify problem intersections, or stretches of road, and better plan upgrades and mitigation efforts.
After much deliberation, and many blocked turns, our team finally nailed down a plan to develop an air conditioner recommendation application late on Saturday night.
Submitted by andrewwharton on Sat, 07/04/2015 - 11:46
Team Name:
ASDFG
Local, national and international (eventually) air quality rankings with daily, monthly and yearly winners.
The system is built on top of the Meteor web framework, using React templating and deployed on the Nectar cloud using a Docker container.
Near realtime data is pulled from various Environmental Protection Agency APIs in various formats and structures (CSV, XML etc.) and normalised into a common format which is then stored in a MongoDB datasbase.
We chose the ABC broadcast data as we felt it was a data set that most people could relate to. Who hasn't spend an afternoon watching ABC?
Using our app users can pick a year and a state and get the most played shows between 3pm and 7pm. We use third party apis like thetvdb and youtube to give some interesting data about the show.
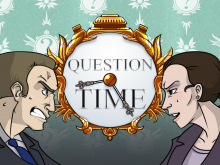
Does anyone really remember how their representatives vote in parliament?
Probably not.
Despite the existence of powerful web-based tools, like TheyVoteForYou and ABC’s Vote Compass, people often don’t know how their representatives are directing their votes.
Talk Gov To Me is 41st Degree Software's submission for GovHack 2015.
Users access Government data through a mobile app, using voice recognition to query a mash up of Open Government data-sets made available for the GovHack 2015 competition.
Talk Gov To Me then responds to the query, using text to speech, to speak directly to the user.
Submitted by Aaron Ross on Sat, 07/04/2015 - 04:11
Team Name:
Full Circle
The Broadcasting Ring - What is it?
The Broadcasting Ring - BRing for short, is a visualisation of a chronological subset of the television broadcast data archive. It attempts to clearly demonstrate to the viewer which shows have been broadcast over the years in a creative and visually distinct manner. The application works by parsing a csv file and populating a series of rings with nodes. Each ring represents a year in broadcasting, with each node making up the ring representing a TV Programme that aired that year.
Submitted by OrinWinter on Fri, 07/03/2015 - 23:59
Team Name:
Settlers Redux
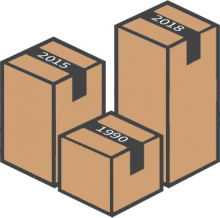
Gross Domestic Product (GDP) is a fundamental statistic used to evaluate the strength of a countries economy. Given the importance of this statistic for policy makers and stakeholders, it is amazing how little individuals know about its measurement and interpretation. Our App, GDP Data Projection seeks to help explain Australia’s GDP statistics by presenting a visual display of Australia’s national GDP and a state-by-state dissection across 24 years of quarterly data.
Submitted by Jessiemmartin on Fri, 07/03/2015 - 23:02
Team Name:
Powderpuff Sugarstuff
Who We Are aims to explore the diversity of Australia's population - where we came from, what we do and believe, and where we're headed. Our team decided early on that we wanted to do a project which highlighted some aspect of the community, with some early options being helping to make local charities more visible, make meeting up with other dog owners at the various dog parks easier, and exploring how youth detention rates are changing.